Author’s note: This is an updated and expanded analysis per my “Ima fix wolves” policy of rewriting and improving previously published essays. It came to mind because I keep seeing startups make mistakes on how to think about the costs of AI products. Please enjoy this explainer on a much-misunderstood topic.
MoviePass is my favorite business of all time. For a brief, glorious period between 2017 and 2018, the company sold an unlimited movie-watching membership for under 15 a pop. Essentially, MoviePass was selling dollars for cents.
Unsurprisingly, people enjoy free things! Their subscriber count jumped from 20,000 to 3 million in a year. All of my friends had it. We would go to the movies at least once a week. We even went if we knew the movie was bad. MoviePass couldn’t be forever, so we felt it was necessary to cash in while we still could. After all, each of us easily cost MoviePass north of $60 a month.
As it turns out, we were right. Giving away money for free is pretty dumb. The company burned through tens of millions of dollars and collapsed by 2019.
MoviePass is my favorite business because I, the consumer, happily took this clueless company’s money and had a blast. It was awesome for me, but it sucked for them.
There is an argument to be made that MoviePass wasn’t a terrible idea. If they had been in the funding environment of 2021, there is a chance they could’ve pulled it off. Get the audience big enough, add advertising on top, plus a pinch of price negotiation with theater companies, and this could’ve been something. But alas, the Fed had yet to turn on the unlimited money spigot, and MoviePass ascended above to the land of dead technology businesses in the sky (this is not the cloud).
Put simply, the cost of the item MoviePass was selling (access to sticky seats) exceeded the price they sold it to me for. No matter how cheap they got their servers, no matter how much they streamlined their marketing and operations, they could never turn a profit until they got their revenue-to-cost-of-goods-sold (COGS) ratio right. Honestly, though, we can’t blame them. They didn’t have this newsletter to teach them.
Today, we are going to dive deep into COGS. While seemingly an easy concept, it has some serious complications. A thorough understanding will help you be a better business practitioner and—if something as absurd as MoviePass ever comes again—be a better value-extracting consumer. Let’s dig in.
COGS in the machine
MoviePass failed, but there are great businesses that lose money for years and are still ultimately successful. Shoot, it took Google three years to get profitable (while simultaneously growing revenue from 69 million [nice]). Ergo, MoviePass just needed more time, and it obviously would’ve been the next Google. This whole argument—which is dumb, by the way—is the reason COGS was invented. To illustrate why, here is a simple example:
Imagine we are looking at the income statement of two businesses, Ding-Dong, Inc. and Galaxy Brain, LLC. You are told they both lost $2,000 in their first year of operation.
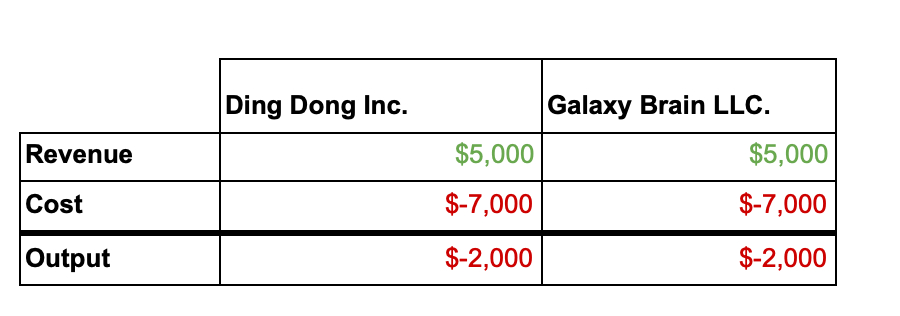
“Ah,” you say as you sensually rub your Patagonia vest like it’s an investing magic 8 ball, “these both must be the next Google.”
But wait! One of your interns is a paying Napkin Math subscriber, and they send you a revised statement.
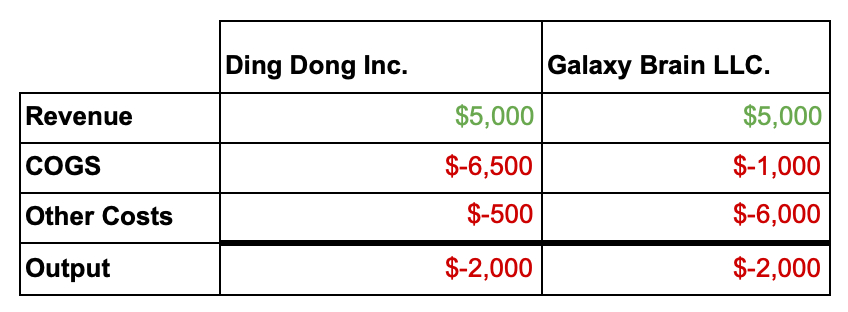
Turns out the Ding-Dongers are literally selling Ding-Dongs (doorbells) for less than it is costing them to create said dongers.
Galaxy Brain, by contrast, is selling software with basically no COGS. So Galaxy Brain, LLC is actually making money for every item they sell! Surely, this must be the better business.
It is obviously more nuanced than that. Whether a high COGS percentage is acceptable or not is dependent on the market and product, but this clarification is the whole point of the income statement. The more intimately you can understand a business, the more accurately you can assess risk.
To understand what the COGS risk is, I should probably finally define what we are talking about.
The definition of COGS
When you sell something, it costs money to make that thing. That is the cost of the goods sold (COGS). Pushes glasses up nose. Specifically, it is the cost associated with the materials and the production of a good that is sold. It does not include the things that are indirectly associated with that sale (marketing, administrative, et cetera).
There are resources online that will take you through the accounting methodologies and the specific formula. That is boring, so we are skipping it. If you are looking to be 100% compliant, use an accountant, not a newsletter.
If you’re running a lemonade stand, for example, water, sugar, and lemons would be the costs directly associated and count as COGS. The more indirect things would be purchasing ads or bribing the city counselors for beverage permits. When companies put together their income statements, it would be pretty difficult to know what’s going on in the business if all those different types of costs were abstracted into one combined number.
But wait, it’s more complicated than that
One of the guiding rules I have for financial analysis is that there is always another layer. By that, I mean there is always a bit of nuance that the spreadsheet hides. Because rules, definitions, and disclosures in finance are so shifty, what is included in COGS evolves.
In my work evaluating startups’ financial documents, I’ve seen people include employee snacks in COGS (wrong), the CEO’s salary (also wrong), and the cost of kibble for the office dog (cute, but still wrong). Even when a company hires an outside firm to audit, that is no guarantee. What is and isn’t included in various expense lines is always a negotiation. Companies almost always want to add more things as part of COGS because it makes their business look better.
But this isn’t just a “haha, startups are stupid” thing—public companies do this all the time, too! I have friends who, bless their hearts, became public accountants at firms like EY or Deloitte. They often tell me of their partners having furious negotiations with in-house teams over what should be included or not. Outside of backroom negotiations, you’ll often see companies play around with COGS versus cost of revenue versus cost of sales. Because these terms aren’t universally agreed upon, they can pick and choose what to include in their term of choice. As an example, let’s take a look at retail companies, which often use cost of sales.
On their 2021 10ks, Best Buy put their disclosure on page 53 and Target on page 42 around their cost of sales definition. While many of the terms are close to identical, there are several that don’t match up at all. Best Buy has “[p]ayroll and benefit costs for services employees associated with providing the services.” Target has “[c]ompensation and benefit costs associated with shipment of merchandise from stores.” Are those the same? Different? Is Target juicing the numbers or is Best Buy? There is no way to tell. Definitions or disclosures never appear for those terms. Target’s own note said it best: “The classification of these expenses varies across the retail industry.”
To be clear, I’m not trying to summon the SEC and proclaim fraud. My point is that COGS is not a stable metric. You can’t look at a business’s COGS line and resolutely say that it is true. Like all financial metrics, it is more of narrative guidance. Think of it as a prop that management can use to help tell the story they’d like people to believe about their business. In both the public and private markets, COGS can be used to help understand a business, but it can’t be used to tell you everything there is to know.
The reality is that all metrics—COGS, revenue, or profits—have more wiggle room than most people realize. A great CFO can make the numbers appear how they want for a quarter or two. This is partially why trusting a management team is such an important part of an investment evaluation. Even if they have an audit, they can still be hiding things, so at some level, you just gotta believe.
How does the market treat COGS?
Even if the actual components of the COGS are murky, there is still directional accuracy when compared across cohorts of similar types of companies. New York University’s business school put together a great database with financial performance averages across industries. Using that, we can visualize the COGS-to-sales ratio of various industries.
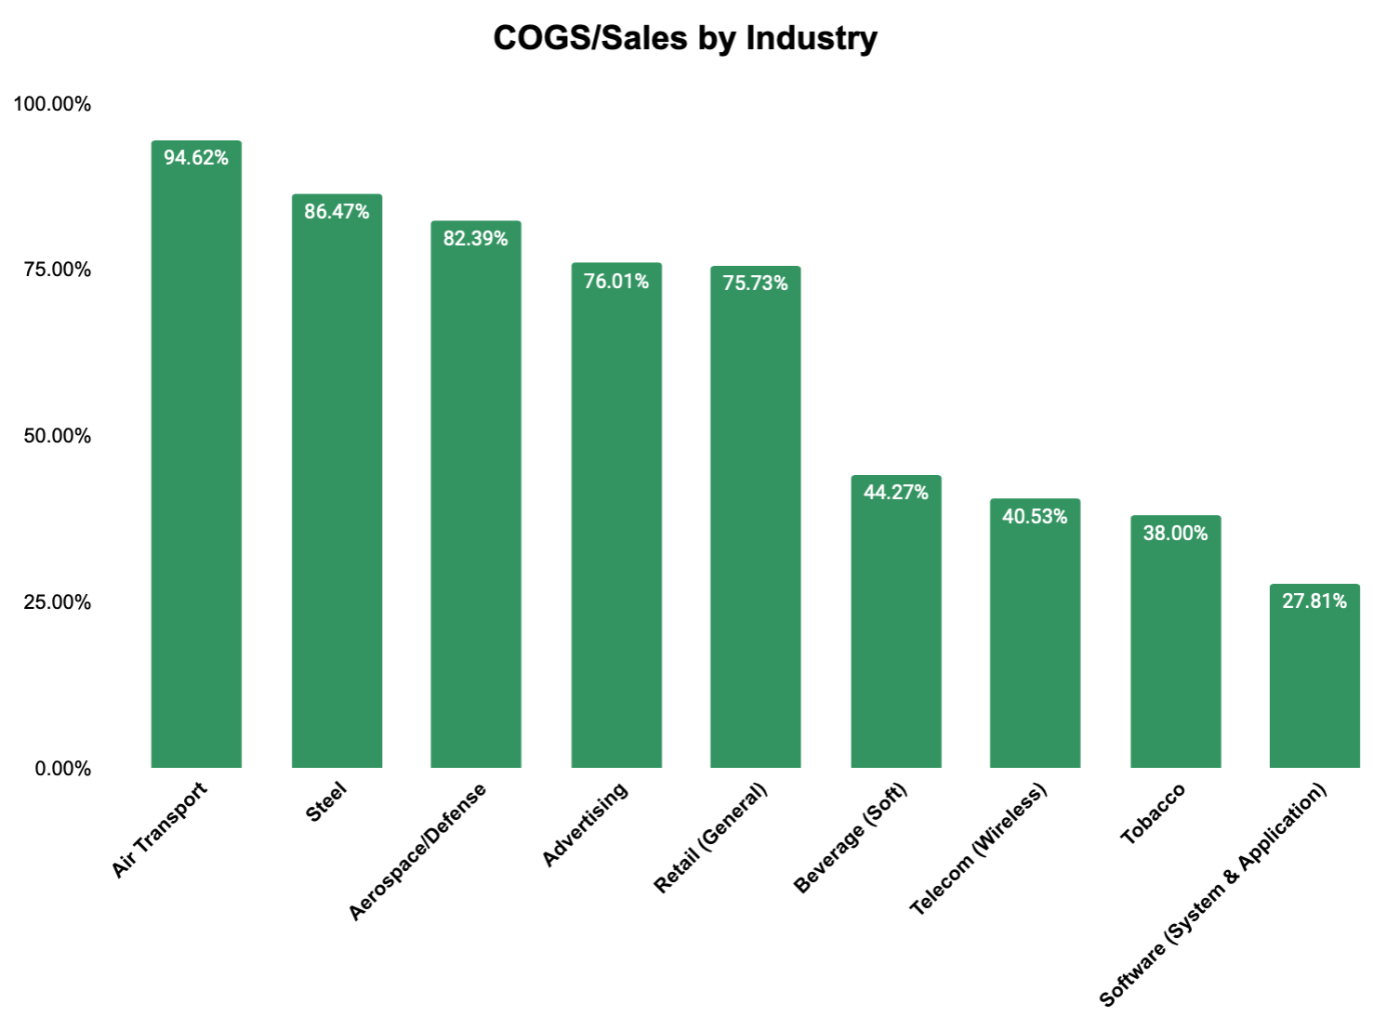
Intuitively, you may think that the industries that are “better” should have a superior COGS-to-sales ratio, right? And that should reflect in their valuation, too? Well, not quite.
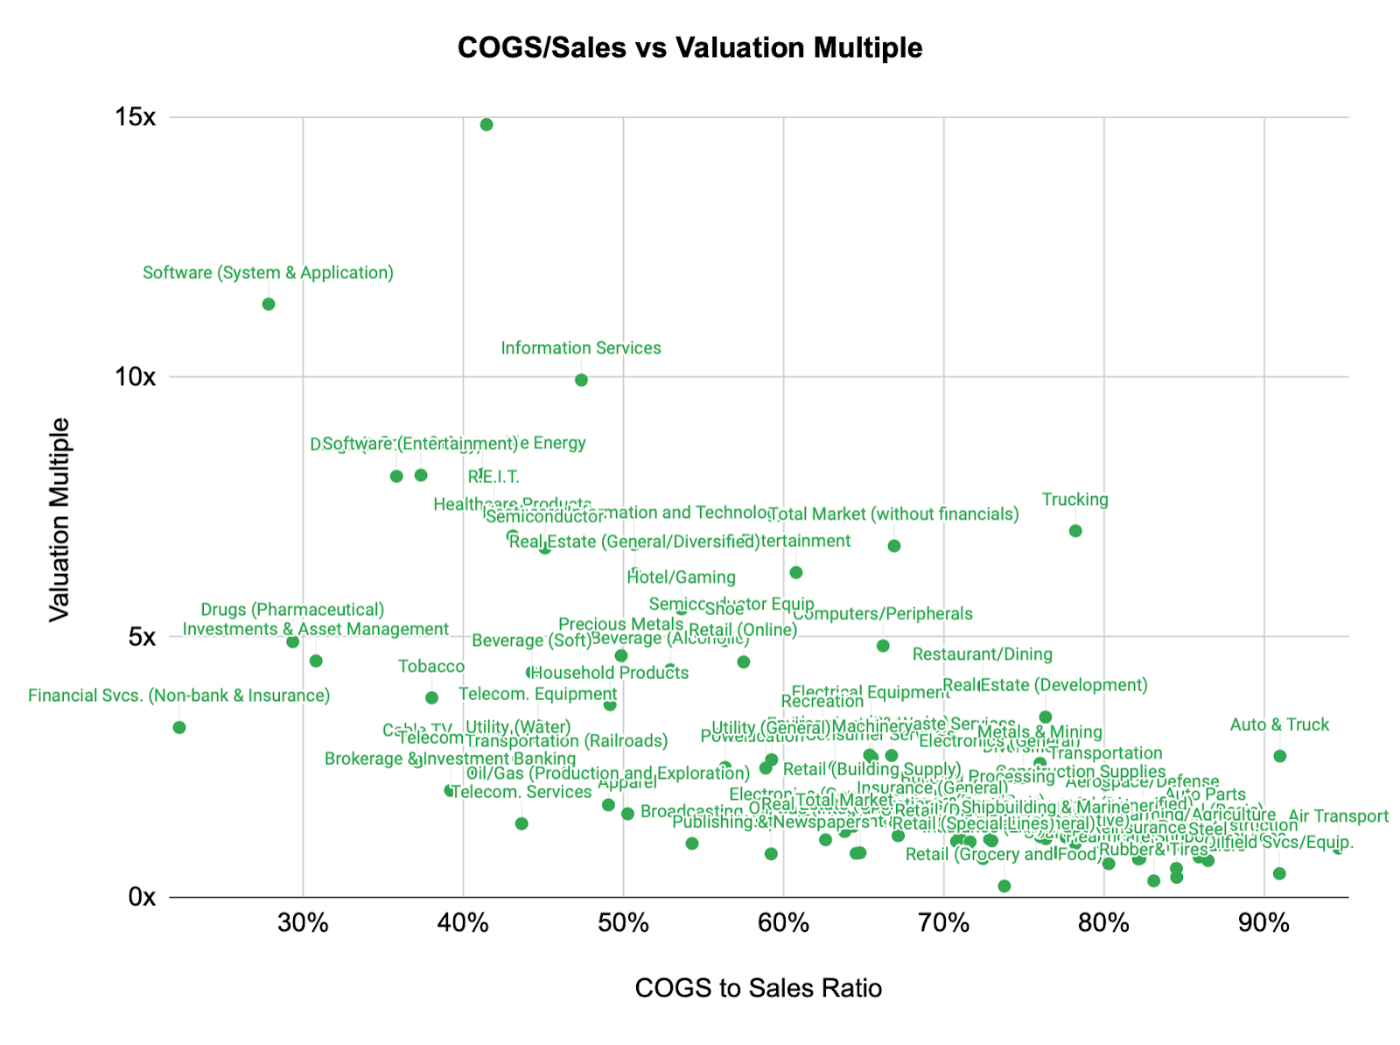
If COGS were an all-powerful metric, we should see a tighter correlation between the average industry asset price than what the data above shows. In some industries, such as real estate and entertainment, the trend holds true. However, there are those that break free of the line of best fit, with technology businesses trading far above what their COGS correlation would imply they should.
Investors value a business based on many variables. Of course, an important one is gross margins (low COGS relative to revenue), but there are other important factors, like operating expenses (costs of running the business that are more indirect don’t get counted in COGS), growth rate, and perceived durability of the business.
It could be people are confident in an industry (investors are really bullish on the whole technology thing), or there is complete delusion about the long-term prospects of an individual stock (cough Gamestop, cough AMC). Or because this data set was pulled in January 2021, COVID made prices so wacky that you can’t take any insight from it at all.
Any competent analyst who says they can tell you exactly why the market does what it does is playing you for the fool. I am not that fool and will tell you that I don’t know. But generally, the better the long-term outlook and financial performance of a sector, the more expensive assets in said sector will be.
Even when you account for sector averages, the companies with superior product cost structures are not necessarily the “best” companies. Some of the most iconic companies have been built on unashamedly high COGS percentages (such as my personal favorite, Costco) to attack their respective markets. High COGS does not equal a bad company; it just means they are operating on a thinner margin of error. So if you commit to a high COGS percentage path, be sure you know what you are doing.
What truly matters
I love talking about COGS because it is a perfect example of how I think about finance. Builders vary between viewing metrics as an inscrutable high science (“if the finance folks say the internal rate of return works, let’s do it”) or something to be completely ignored (see most venture investors).
But to me, studying finance is compelling. It is a glorious, deeply human mystery that whispers its secrets to those who have the patience to dig. Numbers are external indicators of human efforts. They are the magic by which you can discover the history of a business and, sometimes, the method by which you can predict its future.